Handling Volatility
Why short-term volatility looks terrifying but long-term volatility is surprisingly tame — and how diversification across time smooths the ride.
Volatility is the price of admission to equity returns. Over any single year, it can feel unbearable. Over a full investing lifetime, it barely registers. Understanding this distinction is the key to staying invested.
Short-Term Volatility Looks Extreme
In any given year, the range of possible stock returns is enormous. Looking at annual total returns from 1950 to 2025, stocks have delivered as high as +52% and as low as -37% in a single year. That is a spread of nearly 90 percentage points. No wonder investors panic — in the short term, equities look like a coin flip with life-changing stakes.
Bonds, by comparison, show a much narrower band. A 60/40 blended portfolio sits in between. If you only looked at one-year returns, you might reasonably conclude that stocks are too dangerous to hold.
But one-year returns are the wrong lens.
Diversification Across Time
The insight that changes everything is diversification across time. Just as holding many stocks reduces the risk of any single company destroying your portfolio, holding for many years reduces the risk of any single bad year destroying your returns.
Some years will be deeply negative. Others will be strongly positive. Over a long enough horizon, these offset each other. The negative years do not disappear — but they are diluted by the positive years that surround them.
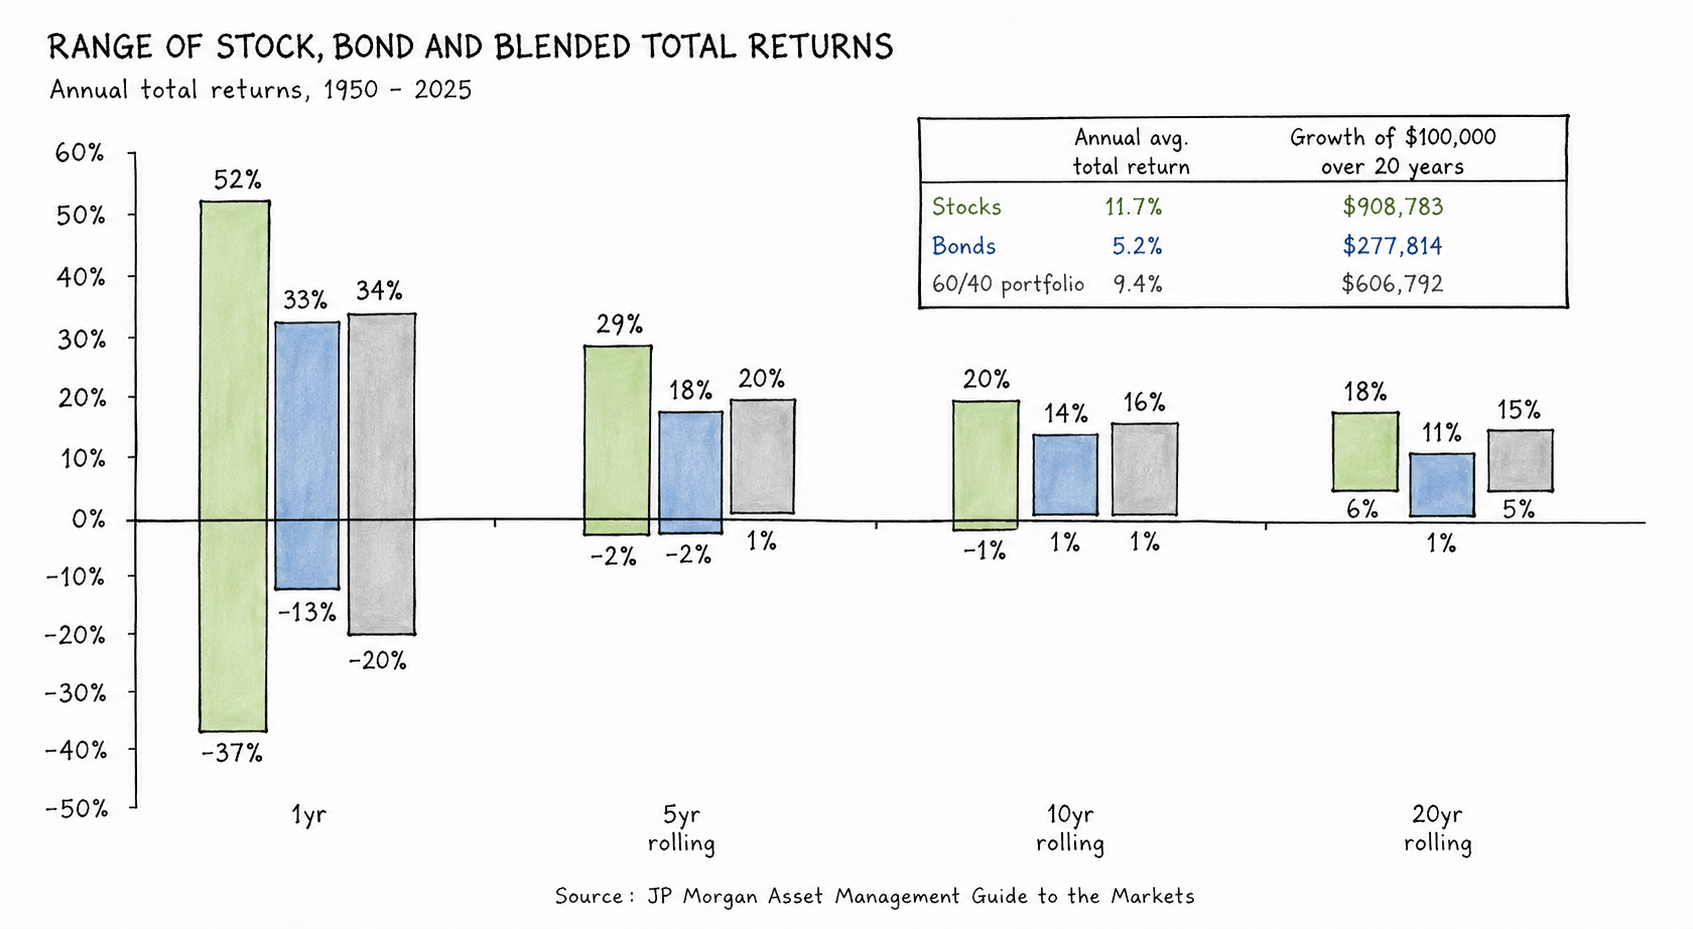
The data is striking. Over rolling 5-year periods, the worst stock return narrows considerably and the best compresses too. Over rolling 10-year periods, negative returns become rare. Over rolling 20-year periods, stocks have essentially never lost money — and their worst performance still delivered meaningful positive returns.
The Annualised Volatility Shrinks
This is not just about averages. The actual dispersion of annualised returns collapses as the holding period lengthens:
- 1-year holding period: returns range from roughly -37% to +52%
- 5-year rolling: the range tightens to roughly -2% to +29%
- 10-year rolling: tighter still, roughly -1% to +20%
- 20-year rolling: the range compresses to roughly +5% to +18%
Over twenty years, the worst-case annualised return for stocks has still been positive — and meaningfully so. The volatility that terrifies in the short term effectively vanishes over a long horizon.
This is why time horizon is not just a preference but a risk management tool. The investor with a 20-year horizon is not taking the same risk as the investor with a 1-year horizon, even if they own exactly the same portfolio.
The Practical Implication
If you know you will not need your capital for twenty years, short-term drawdowns are not risks — they are noise. The real risk is not a bad year. It is pulling your money out during a bad year and locking in the loss permanently.
A $100,000 investment in stocks over 20 years has historically grown to roughly $908,783 at the average annualised return of 11.1%. The same amount in bonds grew to $277,814. A 60/40 portfolio reached $604,792. The gap is enormous, and it is entirely explained by the equity risk premium compounding over time — a premium you only capture by staying invested through the volatility.
Related
- The Long-Term Mindset — why equities dominate over long horizons
- The Power of Compounding — the engine that time-diversification protects
- Equity Risk Premium — the return that rewards those who endure volatility
- Time Horizon as Analytical Constraint — matching your toolkit to your timeframe